The default view of esxtop is CPU, there are several useful counters in this view.
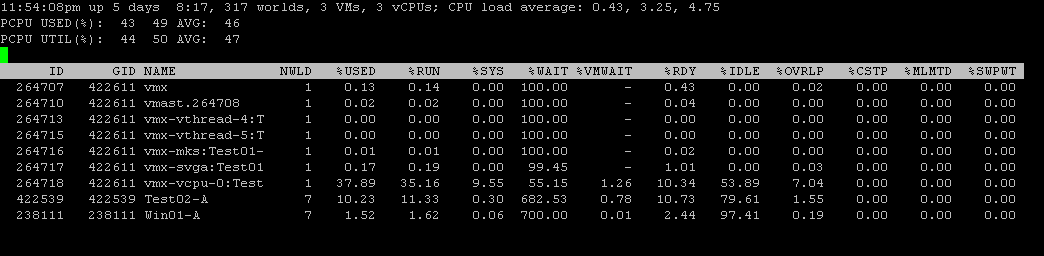
GID – group ID
NAME – virtual machine name
NWLD – number of worlds
%USED – percentage physical CPU time accounted to this world
%RUN – percentage of total scheduled time for the world to run
%SYS – percentage of time spend by system services for that world
%WAIT – percentage of time spent by the world in a wait state
%VMWAIT – derivative of %WAIT except it doesn’t include %IDLE
%RDY – percentage of time the world was ready to run
%IDLE – percentage of time the vCPU world is in idle loop
%OVRLP – percentage of time spend by system services on behalf of other worlds
%CSTP – percentage of time the world spend in ready, co-deschedule state (only relevant to SMP VMs)
%MLMTD – percentage of time world was ready to run but was not scheduled because that would violate “CPU limit” settings
%SWPWT – percentage of time the world is waiting for the VMkernel swapping memory
High CPU ready time is a major indicator of CPU performance issues, you may have excessive usage of vSMP or a limit set (check %MLMTD for that). Another metric to check is %CSTP, this will help you determine whether you can decrease the amount of vCPUs for some of the virtual machines which will help with improving scheduling opportunities.
%SYS is usually caused by high IO virtual machine. %SWPWT is usually caused by memory overcommitment.
