A tool that is very useful is “esxtop.” This command-line tools allows monitoring and collecting of data for the core four resources: CPU, memory, network, and disk.
After enabling SSH on an ESXi host, open up PuTTY and connect to that ESXi host using your root account and password.
Start running esxtop by typing the command on a single line:
Once the tool is running, you need to know how to work with it. It runs from the command line and is managed via key strokes.
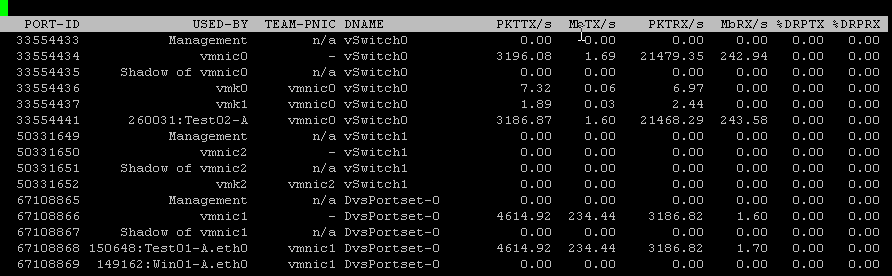
By default, the tools begins running in the CPU view. I can change views by simply typing “n” for the network view, “d” for the disk view, and “m” for the memory view.
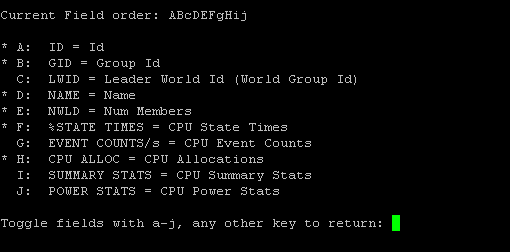
In any view I can type “f” to open up the field screen. From here I can modify which counters are shown in the particular view I am in. I can customize the counters in all of my views. To select/deselect any counter, simply type the letter associated with it. To exit this view, press the space bar.
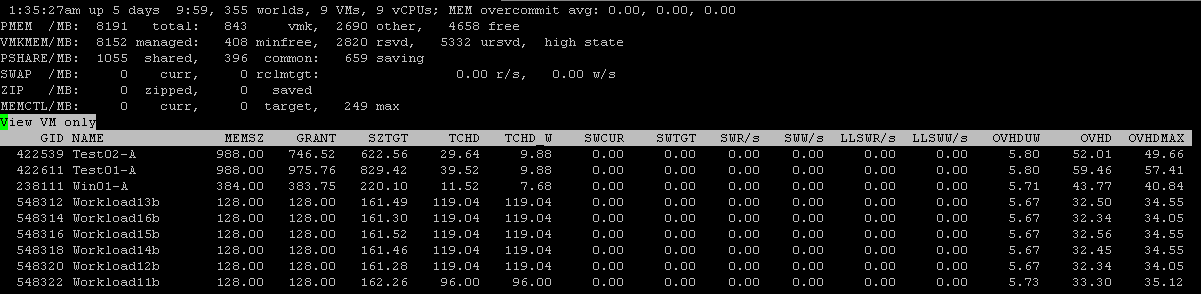
From any view, I can type a “V” (shift + v) to parse the list and only view virtual machine information.
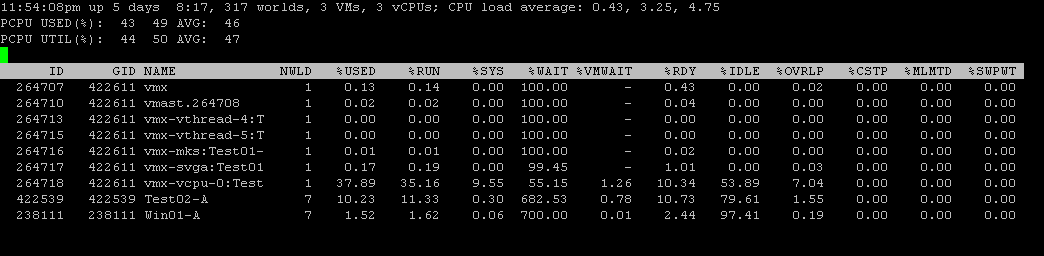
To get even more information about a virtual machine, type “e” and enter the GID (Group ID) of your virtual machine and press enter. In the screenshot, I entered the GID of Test01-A so that I could view all the VM’s associated worlds.
A world is basically just a process. A world is a scheduled component of the VM, like a process on a typical OS. Worlds are scheduled by the VMkernel just like processes are scheduled. The VM is represented as a group, which gets a single world ID. There are worlds within the world to monitor vCPU, VMM, and MKS (Mouse/Keyboard/Screen).
I will be posting more on esxtop and its counters as I go through my studies. This post is just a quick guide to navigating.