The last post discussed navigating esxtop, now let’s get into each view a little bit more.
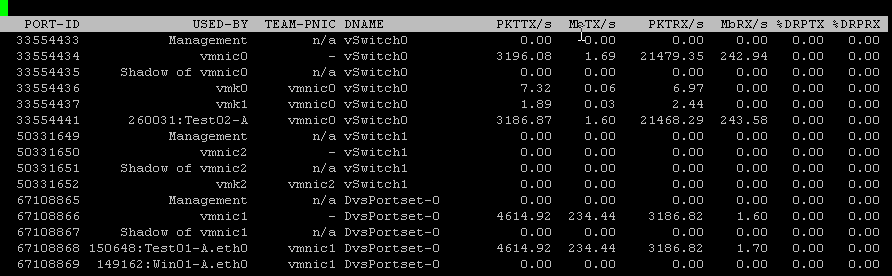
There are several network counters that are default when you go to the networking view, here’s a brief overview of each:
PKTTX/s – # of packets transmitted per second
MbTX/s – MegaBits transmitted per second
PKTRX/s – # of packets received per second
MbRX/s – MegaBits received per second
%DRPTX – percentage of transmit packets dropped
%DRPRX – percentage of receive packets dropped
A major indicator of potential network performance issues is dropped packets. This can be indicative of a physical device failing, queue congestion, bandwidth issues, etc.
Something else to check when having network issues is high CPU usage, the CPU Ready Time counter (%RDY) can be beneficial when diagnosing CPU issues.
If you are having these issues in your environment, consider using jumbo frames, taking advance of hardware features provided by the NIC like TSO (TCP Segmentation Offload) and TCO (TCP Checksum Offload)
Also, make sure to check out physical network trunks, interswitch links, etc for overloaded pipes.
Consider: moving the VM with high network demand to another switch, adding more uplinks to a virtual switch and check for which vNIC driver is being used.

Leave a comment