There are many useful things to look at when in the memory view of esxtop.
Several important things to look at near the top of the esxtop.
PMEM /MB – memory for the host
VMKMEM /MB – memory for the VMkernel
PSHARE /MB – ESXi page sharing statistics
SWAP /MB – ESXi swap usage statistics
ZIP /MB – ESXi compression statistics
MEMCTL /MB – ESXi balloon statistics
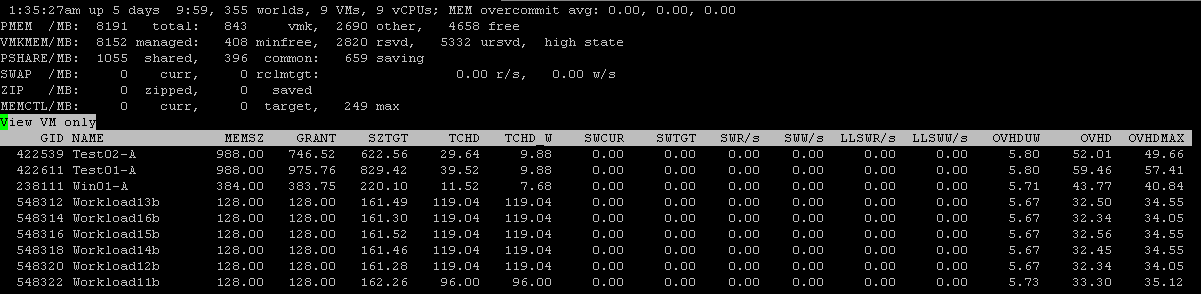
Now looking at the virtual machines down below host information, you can see several counters listed that can be of use when troubleshooting an individual VM or group of VMs:
MEMSZ – amount of configured guest physical memory
GRANT – amount of guest physical memory granted
SZTGT – amount of memory to be allocated to a machine
TCHD – amount of guest physical memory recently used by the VM
TCHD_W – write working set estimate for a resource pool
SWCUR – current swap usage
SWTGT – expected swap usage
SWR/s – swap in from disk rate
SWW/s – swap out to disk rate
LLSWR/s – memory read from host cache rate
LLSWW/s – memory write to host cache rate
OVHDUW – overhead memory reserved for the vmx user world of a VM group.
OVHD – amount of overhead currently consumed by a VM
OVHDMAX – amount of reserved overhead memory for a VM
Ideally, you’ll look at esxtop and never see any kind of numbers for balloon, compression or swap activity. However if you do see this activity then the ESXi host is overcommitted and is in contention. More resources need to be added the the ESXi host, the cluster or some of the VMs need to be moved to an ESXi host with memory resources available.

Leave a comment