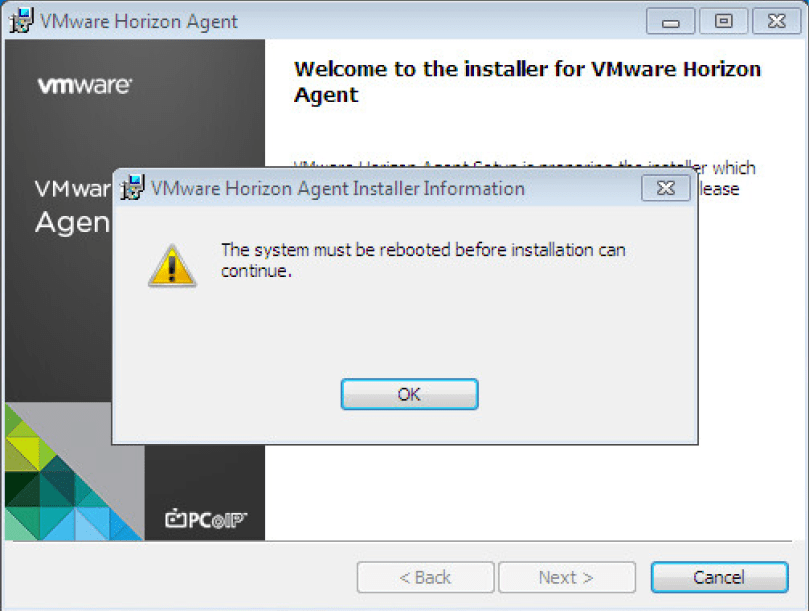
Horizon Agent fails to install: “system must be rebooted” error

Nothing is more fun than walking into a client site on a Monday morning and something that’s supposed to be easy (installing Horizon Agent in base image) doesn’t work.

I logged into the Windows 7 virtual desktop image and tried to install the Horizon Agent, however, I received a message stating: “The system must be rebooted before installation can continue.” Seemed simple enough, so I restarted the machine, and tried again. Same error. #facedesk

00.png

Did some digging and found an old KB (1029288). The KB doesn’t say that it is applicable to Horizon View 7.0.x but it solved the issue I was having.

First I tried to uninstall and re-install VMware Tools. No luck.

I went through the registry keys suggested by the aforementioned KB but there weren’t any associated strings associated with the registry keys.

At the very end of the list, two registry keys were listed:

  • HKEY_LOCAL_MACHINE\Software\Microsoft\Windows\CurrentVersion\RunOnce\
  • HKEY_LOCAL_MACHINE\Software\Microsoft\Windows\CurrentVersion\RunOnceEx\

There were values located in HKLM\Software\Microsoft\Windows\CurrentVersion\RunOnce, so I deleted all the values, rebooted the machine.

Voilà! I was finally able to get the Horizon Agent to install so I could proceed with my day. It appeared that there was a previously failed installation that was preventing the Horizon Agent from launching its own installer.

Horizon 7 Instant Clones – Folder Structure

When provisioning Horizon 7 Instant Clones, you may have noticed some new folders that were created in the VM and Template view in the vSphere Web Client.

Screen Shot 2016-12-19 at 9.37.17 AM.png

Each of these folders has a specific purpose for Instant Clones:

  • ClonePrepInternalTemplateFolder
    • cp-template-xxxx –  Virtual machine that is a template used to create Instant Clones; this is created from the master image.
  • ClonePrepParentVmFolder
    • cp-parent-xxxx – These virtual machines exist in a 1:1 relationship to the number of ESXi hosts in the cluster. I have a four node cluster, therefore I have 4 clone prep parent virtual machines. Each ESXi host has one of these powered on and in memory in order to provision the Instant Clone VMs.
  • ClonePrepReplicaVmFolder
    • cp-replica-xxxx – This virtual machine is used to create the clone prep parent virtual machines. It will be also used as necessary to provision additional clone prep parent virtual machines.
  • ClonePrepResyncVmFolder
    • If the Instant Clones are updated with a new image, a virtual machine will be created here for staging purposes.

Learning from Failure – My Path to VCDX (Part II)

ICYMI, you can find Part I here.

Second Attempt – Pass!

The important decision to make whether I should wait or reapply immediately. Brett and I talked a lot about this over the two days following our results. I decided that I would shore up the gaps in our design (primarily our DR plan and the capacity planning) and reapply for the November defense. The deadline for application was Aug 24…that meant I had slightly less than two weeks to edit the design and reapply. Brett decided to wait because he had a lot of work obligations for the second half of the year. Per policy, VCDX partners can defend separately (however, must apply at the same time) but must be within two defenses of each other.

In case you did not know, a second defense on the same design requires a change log to be created. Check out Lior Kamrat’s blog post here.

In hindsight, it was a crazy move to reapply so quickly. Between application and defense in November, I had VMworld US, two Europe trips, and VMworld EU…translating to not a lot of time to prepare. But I felt like I had a better idea of what I needed to do and what the panelists wanted to see.

I talked to many VCDX candidates and VCDXs while at VMworld US and VMworld EU. I listened to all their advice and how they prepared. I’m grateful for the time that so many spent with me.

This time I decided to prepare differently. I was going to do it my way. I went into a little bit of an isolation; I didn’t tweet about it. I didn’t work with as many people, I kept my group small. I just focused on working with my study group. I didn’t do as many mocks for myself (I think only two or three), but I participated in quite a few mocks as a “panelist” for others. I created flashcards for questions I thought panelists would ask. And I completely rebuilt my slide deck so that the intro (or main deck) would talk more to my requirements and constraints, as well as specifically highlight my design decisions.

I went up to Palo Alto a few days before my defense to do some mocks and study with a member of my study group. Unluckily, my defense was the morning after the US election so I stayed up later than I had planned. I went over my slide deck, slide-by-slide, with someone in my study group that night. I woke up early, flipped through my main deck one last time, and then headed to VMware’s campus. While I waited for my panel, I reviewed through my Quizlet sets one more time.

Honestly, I wasn’t sure how I did. I felt more comfortable in the design scenario because I did what I normally do with a client—I wasn’t so focused on following someone else’s template. In the defense section, I felt I did ok but I could tell I wasn’t doing well explaining my networking. I got a little ramble-y in that area. I think I may have made up for that in the scenario. Either way, I was convinced I’d failed again.

To VMware’s credit, they cranked out our results much quicker than in July. I defended on Wednesday and found out my results the following Tuesday. I passed! I’m officially #243.

giphy1

My Thoughts  

  • Make sure your friends and family realize how much time you’ll be dedicating to VCDX.
  • No (wo)man is an island. Surround yourself with a community of others doing the same.
  • Join a study group. Gregg Robertson runs a great one on Google+ and Slack. Join it! But then find a smaller group who are preparing to defend around the same time as you.
  • Have someone (or multiple people) review your design as you are writing it.
  • Review your design and have someone else review your design once submitted. There will be gaps and errors—-find them! Figure out how to address them in your defense.
  • Do mocks! Do more mocks!!
  • Create backup slides in your PPT for reference, but do not be afraid to whiteboard in your defense.
  • Be familiar with your slide deck. You don’t want to waste time fumbling around looking for a slide in the defense. Work out those kinks in mocks.

But you should do what feels right to you. Don’t focus on the techniques that helped others. Don’t feel the need to follow someone else’s template. Achieve VCDX your own way. Grant Orchard (#233) just wrote a brilliant post along the same lines, read it here.

Obligatory Thank You(s) 

First and foremost, I would like to thank my VCDX partner, Brett Guarino, and his wife, Leann, for putting up with us working weekends and late nights and letting me stay all of those weeks in their home in Raleigh while we worked. Thank you to Brett’s managers at VMware for letting him dedicate time to this project. I can’t wait until he gets his number.

And a massive thank you to:

Lastly, Chris Williams, thank you so much for being the only person who responded with notes when we sent our design out for review. Your time reading our design is greatly appreciated and your notes were invaluable.
Virtual Machine Files

vSphere administrators should know the components of virtual machines. There are multiple VMware file types that are associated with and make up a virtual machine. These files are located in the VM’s directory on a datastore. The following table will provide a quick reference and short description of a virtual machine’s files.

net-dvs Command

In order to view more information about the distributed switch configuration, use the net-dvs command. This is only available in the local shell. Notice that it specifies information like the UUID of the distributed switch and the name. We can also see information regarding Private VLANs if we have those set up.

If we keep scrolling down, we can see the MTU and CDP information for the distributed switch. Notice that we can set up LLDP for a distributed switch. Next we see information regarding the port groups and how they are configured, we see VLAN and security policy information here. At the bottom we see some stuff on a network resource pool if we have network i/o control enabled and are using this feature.

The last section we see on the net-dvs output we see is some information that is very useful during the troubleshooting process. We can see whether or not packets are being dropped and we can see from the amount of traffic going in and out and decide on whether we need to traffic shape.

esxtop Memory View

There are many useful things to look at when in the memory view of esxtop.

Several important things to look at near the top of the esxtop.

PMEM /MB – memory for the host

VMKMEM /MB – memory for the VMkernel

PSHARE /MB – ESXi page sharing statistics

SWAP /MB – ESXi swap usage statistics

ZIP /MB – ESXi compression statistics

MEMCTL /MB – ESXi balloon statistics

Now looking at the virtual machines down below host information, you can see several counters listed that can be of use when troubleshooting an individual VM or group of VMs:

MEMSZ – amount of configured guest physical memory

GRANT – amount of guest physical memory granted

SZTGT – amount of memory to be allocated to a machine

TCHD – amount of guest physical memory recently used by the VM

TCHD_W – write working set estimate for a resource pool

SWCUR – current swap usage

SWTGT – expected swap usage

SWR/s – swap in from disk rate

SWW/s – swap out to disk rate

LLSWR/s – memory read from host cache rate

LLSWW/s – memory write to host cache rate

OVHDUW – overhead memory reserved for the vmx user world of a VM group.

OVHD – amount of overhead currently consumed by a VM

OVHDMAX – amount of reserved overhead memory for a VM

Ideally, you’ll look at esxtop and never see any kind of numbers for balloon, compression or swap activity. However if you do see this activity then the ESXi host is overcommitted and is in contention. More resources need to be added the the ESXi host, the cluster or some of the VMs need to be moved to an ESXi host with memory resources available.

esxtop CPU View

The default view of esxtop is CPU, there are several useful counters in this view.

GID – group ID

NAME – virtual machine name

NWLD – number of worlds

%USED – percentage physical CPU time accounted to this world

%RUN – percentage of total scheduled time for the world to run

%SYS – percentage of time spend by system services for that world

%WAIT – percentage of time spent by the world in a wait state

%VMWAIT – derivative of %WAIT except it doesn’t include %IDLE

%RDY – percentage of time the world was ready to run

%IDLE – percentage of time the vCPU world is in idle loop

%OVRLP – percentage of time spend by system services on behalf of other worlds

%CSTP – percentage of time the world spend in ready, co-deschedule state (only relevant to SMP VMs)

%MLMTD – percentage of time world was ready to run but was not scheduled because that would violate “CPU limit” settings

%SWPWT – percentage of time the world is waiting for the VMkernel swapping memory

High CPU ready time is a major indicator of CPU performance issues, you may have excessive usage of vSMP or a limit set (check %MLMTD for that). Another metric to check is %CSTP, this will help you determine whether you can decrease the amount of vCPUs for some of the virtual machines which will help with improving scheduling opportunities.

%SYS is usually caused by high IO virtual machine. %SWPWT is usually caused by memory overcommitment.

esxtop Network View

The last post discussed navigating esxtop, now let’s get into each view a little bit more.

There are several network counters that are default when you go to the networking view, here’s a brief overview of each:

PKTTX/s – # of packets transmitted per second

MbTX/s – MegaBits transmitted per second

PKTRX/s – # of packets received per second

MbRX/s –  MegaBits received per second

%DRPTX – percentage of transmit packets dropped

%DRPRX – percentage of receive packets dropped

A major indicator of potential network performance issues is dropped packets. This can be indicative of a physical device failing, queue congestion, bandwidth issues, etc.

Something else to check when having network issues is high CPU usage, the CPU Ready Time counter (%RDY) can be beneficial when diagnosing CPU issues.

If you are having these issues in your environment, consider using jumbo frames, taking advance of hardware features provided by the NIC like TSO (TCP Segmentation Offload) and TCO (TCP Checksum Offload)

Also, make sure to check out physical network trunks, interswitch links, etc for overloaded pipes.

Consider: moving the VM with high network demand to another switch, adding more uplinks to a virtual switch and check for which vNIC driver is being used.

Navigating ESXTOP

A tool that is very useful is “esxtop.” This command-line tools allows monitoring and collecting of data for the core four resources: CPU, memory, network, and disk.

After enabling SSH on an ESXi host, open up PuTTY and connect to that ESXi host using your root account and password.

Start running esxtop by typing the command on a single line:

esxtop
Once the tool is running, you need to know how to work with it. It runs from the command line and is managed via key strokes.
By default, the tools begins running in the CPU view. I can change views by simply typing “n” for the network view, “d” for the disk view, and “m” for the memory view.
 
d532c-1
 
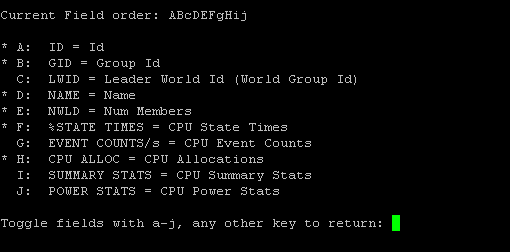
In any view I can type “f” to open up the field screen. From here I can modify which counters are shown in the particular view I am in. I can customize the counters in all of my views. To select/deselect any counter, simply type the letter associated with it. To exit this view, press the space bar.
 
191fa-2

From any view, I can type a “V” (shift + v) to parse the list and only view virtual machine information.

3e4a7-3
 
To get even more information about a virtual machine, type “e” and enter the GID (Group ID) of your virtual machine and press enter. In the screenshot, I entered the GID of Test01-A so that I could view all the VM’s associated worlds.
 
f8108-4
 
A world is basically just a process. A world is a scheduled component of the VM, like a process on a typical OS. Worlds are scheduled by the VMkernel just like processes are scheduled. The VM is represented as a group, which gets a single world ID. There are worlds within the world to monitor vCPU, VMM, and MKS (Mouse/Keyboard/Screen).
 
26e5c-5
 
I will be posting more on esxtop and its counters as I go through my studies. This post is just a quick guide to navigating.

Organizational Networks in vCloud Director 5.1

Organization Network

An organization network provides network services to one particular organization, whereas an external network is created at the provider level and supplies connectivity to multiple organizations. There are three options when creating organization networks: internal, NAT-connected, and direct-connected. An organization administrator cannot create an organization network due to the configuration of external IPs; only a system administrator can configure this.

Internal

An organization can be set up so that it does not have a connection to the Internet or a connection to any other external network, just an internal connection. An internal-only network could be set up for groups of test virtual machines; a virtual machine can be configured with multiple network interfaces so that it has a connection to the internal network as well as one of the other two types. With an internal organization network, vApps can connect, but there is no traffic outside the organization.

Network Address Translation (NAT)-Connected

Network Address Translation (NAT)-connected, sometimes called a “routed network,” can be connected to the external network through a vShield Edge device. The vShield Edge device provides port-forwarding services, NAT, DNS forwarding, and DHCP services to the network; the vShield Edge device gets provisioned automatically
by vCloud Director as needed. A NAT connection allows for virtual machines to communicate with each other while only having one IP seen from the Internet. Another use of NAT is to fence, which includes two sets of IP addresses: external and internal. Fencing allows for several vApps to utilize the same internal IP addresses and extremely useful for test environments.

Direct Communication

The last option for an organization network is a direct connection. The organization would use an external net- work to connect to external systems, including the Internet. Using this method, a user can connect directly to a virtual machine using remote desktop or even SSH. If a vApp configured for a direct connection then the vApp’s IP addresses must be statically assigned or a DHCP server must be connected to the external providing the vApp with those IP addresses.

For further reading, check out my vCloud Director 5.1 Networking Concepts white paper!